Energy lies at the very heart of the conversation about climate change. While power generation is a top source of emissions and typically takes center stage, energy utility networks also play a critical role. As the world transitions to a low-carbon economy, emissions reductions in this sector will become increasingly important.
But before they can decarbonize, energy utility network companies must understand the factors driving their greenhouse gases. To establish a baseline picture of leading emission sources in the industry, Persefoni analyzed data from the CDP (formerly Carbon Disclosure Project), the largest global database of climate reporting.
In this article, we’ll take a look at the emissions profile of the energy utility networks sector — along with the unique challenges and opportunities companies in this field may face in calculating and managing their carbon footprints.
What is an Emissions Profile?
An emissions profile offers a starting point for carbon accounting.
One of the first steps in beginning a carbon accounting journey is identifying which emission sources you need to track in order to accurately measure your footprint in line with industry best practices.
An emissions profile helps answer this question, by providing an overview of a sector or company’s greenhouse gas emissions, with details on material sources and amounts. It serves as an initial guide that allows you to see which business activities contribute to your company’s carbon footprint, and understand the financial and operational data you’ll need in order to complete robust, audit-grade carbon accounting.
When you’re armed with a comprehensive understanding of your carbon footprint, you can identify emissions hotspots and make more efficient reductions — accelerating progress on your climate goals. We’ll dig deeper into the specific emissions profile for energy utility networks later in this article.
The Energy Utility Network Landscape
The sector is under pressure and evolving rapidly.
Energy utility networks are vital to our lives — they provide power to our businesses, homes, schools, hospitals, and more. The industry is also in the spotlight when it comes to the transition to a low-carbon economy. Companies face a slew of challenges on this front, from changing markets to regulatory trends. Within the sector, the CDP has identified two distinct sub-categories, each with its own needs and concerns:
Electricity Networks: Companies in this category transmit and distribute electricity from various generation sources to end users. Emissions vary depending on the energy mix and the extent of renewable energy integration. The infrastructure is complex, involving high-voltage transmission and lower-voltage distribution systems.
Gas Utilities: This category includes entities involved in the distribution of natural gas through a network of pipelines to various consumer bases. Natural gas is often seen as a bridge towards a lower carbon future, but it is still a significant source of greenhouse gases, in large part due to methane leaks.
Sustainability Trends and Pressures
Climate change is not just altering our ecosystems, it is transforming consumer behavior, policy trends, and global markets. Energy lies at the crux of this dramatic shift — and both electricity networks and gas utilities now face acute pressure to adapt. The forces reshaping the industry include:
- Renewable Energy Integration: The increasing integration of clean energy sources such as solar and wind into the grid is a positive trend, but it creates challenges for energy utility networks, due to the intermittent nature of these sources.
- Decentralization and Microgrids: The move towards decentralized energy systems and microgrids offers improved resilience and efficiency but requires energy utility networks to provide sophisticated management to ensure grid stability.
- Electrification and Demand Growth: As sectors like transportation and heating electrify, managing the growing energy demand is a pressing challenge.
- Aging Infrastructure and Resilience: Upgrading aging infrastructure to be more efficient and resilient — particularly against extreme weather events and cyberattacks — is an ongoing concern in the sector.
- Regulatory and Policy Changes: Lawmakers are increasingly focused on policies that reduce emissions in the energy sector, and energy utility networks must keep up with a rapidly evolving regulatory landscape.
What are ‘Material Emissions’ for Energy Utility Networks?
Material emissions are significant to a company's overall carbon footprint.
Emissions are considered material if they make a significant contribution to your total greenhouse gas emissions. In this context, ‘material’ commonly refers to sources that account for at least 5% of total GHG emissions in the scope 1, 2, or 3 categories.
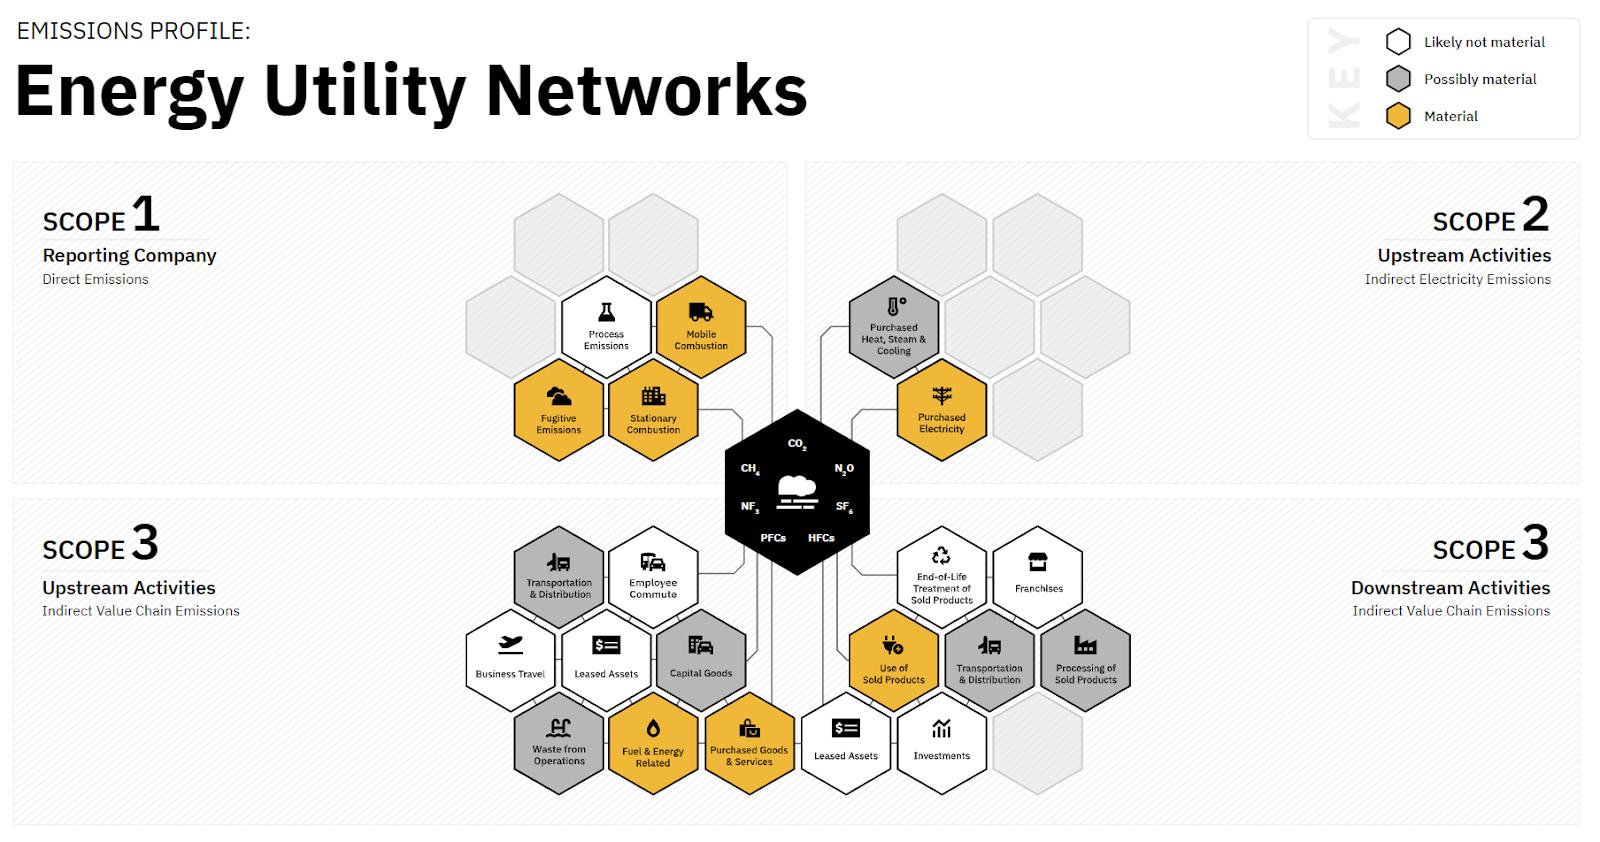
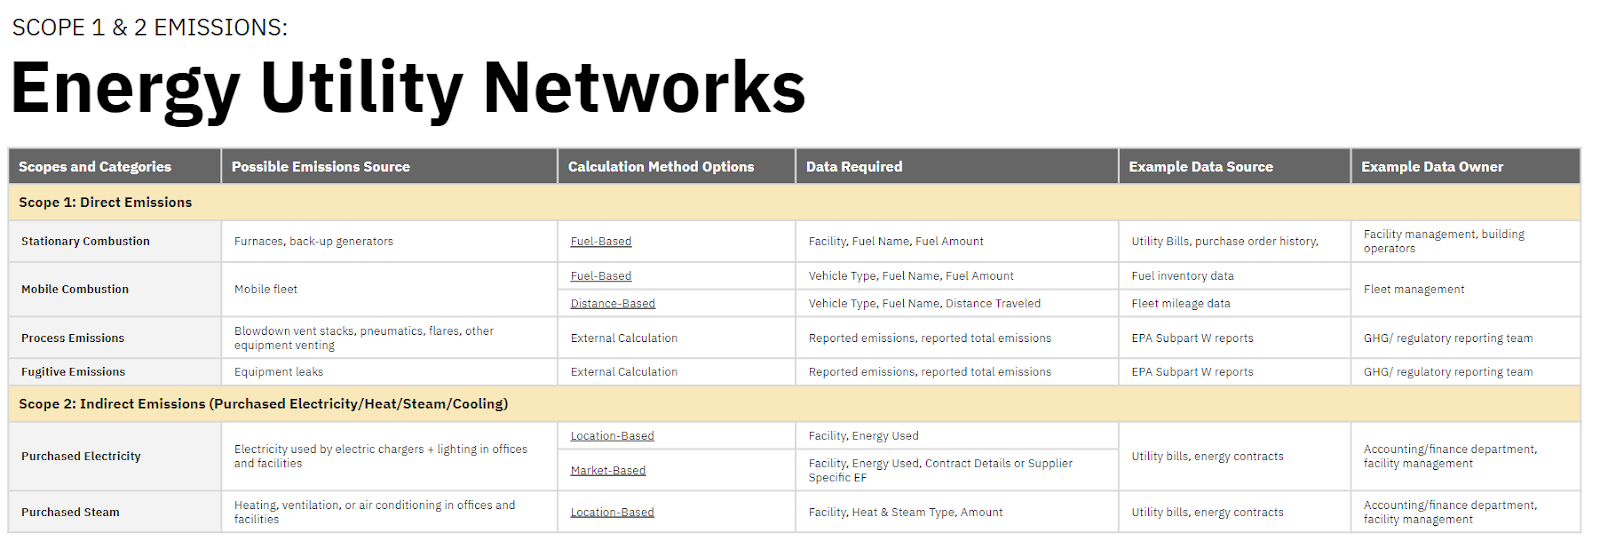
For example, in the Energy Utility Networks sector, material emissions may arise from sources such as stationary combustion (emissions that come from burning fuels in a company’s fixed installations, like furnaces or backup generators), mobile combustion (owned or leased vehicles and equipment used by the company), fuel and energy-related activities (well-to-tank - upstream - emissions from purchased fuels), and the use of sold products (fuel and energy consumption that results from the use of the company’s products).
What Does the Emission Profile Look Like for Energy Utility Networks?
Many sources contribute to the industry’s footprint.
The energy utility network industry is complex, and its emissions originate from a variety of sources, including scopes 1, 2, and 3. The emissions profile outlined below highlights heavy sources in the industry.
This information is based on Persefoni’s analysis of carbon benchmarking data from the CDP, which gathers voluntary climate disclosures from organizations around the world. It is intended to help companies understand the business activities that make up their carbon footprint and provide a roadmap for more comprehensive carbon accounting.
Scope 1 Emissions
Scope 1 emissions are direct emissions generated from the sources that are owned or controlled by the business. Depending on the sub-industry, scope 1 emissions may look slightly different.
For electricity networks, scope 1 typically includes emissions from owned power generation activities, such as burning fossil fuels like coal, natural gas, or oil to generate electricity. It could also include emissions from on-site equipment or vehicles used in the operation and maintenance of the grid infrastructure.
For gas utilities, scope 1 generally encompasses direct emissions from owned assets such as compressors, which are used to transport gas within pipelines; vented gas from planned or unplanned maintenance activities; and leaking methane from natural gas pipelines, compressor stations, or gas storage facilities.
Scope 2 Emissions
This category covers indirect emissions resulting from the generation of electricity, heat, or steam that a business consumes. They come from sources owned or controlled by another entity but used by the reporting company.
For electricity networks, scope 2 emissions typically result from the consumption of electricity by the utility itself, when that electricity is purchased from an external source like a power plant.
In the case of gas utilities, they arise from the consumption of electricity for operations like compressing natural gas, maintaining pipelines, or running office buildings.
Scope 3 Emissions
Scope 3 covers indirect upstream and downstream emissions produced in the value chain. They often account for the majority of a company’s emissions and can be complicated to calculate since they are not owned or directly controlled by the business.

For electricity networks, scope 3 emissions typically come from upstream supply chain sources, such as the manufacturing and transport of equipment and materials used in constructing and maintaining grid infrastructure, like transformers and cables. It can also include transmission and distribution losses that occur when electricity is sent over long distances or distributed through the grid, since these losses are outside the utility’s direct control.
In the case of gas utilities, various indirect sources generate scope 3 emissions. These include supply chain emissions from the extraction, processing, and transportation of natural gas supplied by the utility — for example, drilling operations, gas processing facilities, and pipelines. In contrast to electricity, scope 3 emissions for gas networks include the combustion of natural gas by end-users, such as residential, commercial, and industrial customers.
What’s Next? A Playbook for Emissions Management in Energy Utility Networks
A step-by-step approach to assessing your footprint.
Energy utility networks are under pressure to provide transparent, reliable, traceable data about their climate impacts. An emissions profile is just a starting point — to meet the growing demand from stakeholders and regulators for high-quality data, companies ultimately need to conduct robust carbon accounting.
This process is complex, but it doesn’t have to be overwhelming. Here’s a step-by-step approach to getting started:
1. Create a Project Management Plan
- Designate a project leader: Appoint a dedicated individual to lead your GHG inventory project. This person should have the authority, knowledge, and resources to effectively drive the project.
- Secure buy-in: Ensure top-level management supports the project, as their backing is crucial for its success, as well as resource allocation.
- Set internal deadlines: Establish clear timelines for each phase of the project to maintain momentum and accountability.
- Develop an IMP: Create a detailed inventory management plan (IMP) that outlines procedures and methodologies for GHG data collection, calculation, and reporting. This plan should be regularly updated to reflect any changes in operations or reporting standards.
- Ensure consistency: The IMP should establish consistent and repeatable processes for each reporting period, for more reliable and comparable data. Automated carbon accounting software will help ensure you’re working with reliable and comparable data.
2. Identify and Assess Emission Sources
- Review potential sources: Examine all possible emission sources as outlined by the Greenhouse Gas Protocol. This includes direct emissions (Scope 1), indirect emissions from purchased energy (Scope 2), and all other indirect emissions (Scope 3).
- Assess materiality: Materiality thresholds will vary from company to company. You’ll need to conduct a thorough materiality assessment, following guidance for your industry and regulatory jurisdiction.
- Create a checklist: Develop a Footprint Source Checklist detailing all material sources identified for tracking and data collection.
3. Gather Emissions Data
- Assign data owners: Identify individuals responsible for collecting data for each emission source. These could be department heads or facility managers.
- Set data collection deadlines: Ensure timely collection of data by establishing and communicating clear deadlines.
- Collect data: Each category of data will present different challenges. Scope 1 and 2 data will generally be straightforward as they rely on internal information, while scope 3 will be complex. You can start by identifying top suppliers and understanding the carbon intensity of your raw materials.
- Conduct quality assurance: Designate a person or team to review the collected data for accuracy and completeness.
4. Collaborate for Better Data
- Engage suppliers directly: Establish communication with suppliers to gather detailed data, understand their processes, and set expectations for future improvements. Using the same shared carbon accounting software as your suppliers can make this process easier.
- Incentivize emissions reductions: Use the collected data to preferentially source from lower-emission companies and encourage suppliers to adopt practices that reduce their carbon footprints.
Navigating the Path to a Lower Carbon Future
Energy utility networks will play a pivotal role in the transition to a low-carbon economy. For this sector, adapting to rapidly changing stakeholder demands and regulatory requirements is particularly challenging — but with strategic planning, it’s achievable. You can use an emissions profile as a roadmap to help guide more robust carbon accounting and climate planning in the future.
By ensuring your data is transparent, traceable, and reliable, you can minimize regulatory and reputational risk — and accelerate progress on your climate goals.
.png)